Gold and Silver Price Today: Fed, ECB and Hormuz Outlook
Gold and Silver Right Now
As of the New York morning session on July 22, 2026, gold (XAU/USD) is trading in the $4,100–$4,140 range, up roughly 1–1.7% on the day. Silver (XAG/USD) has climbed back above $56.50–$57, a sharper rebound after last week’s selloff. (Quotes vary by a few dollars between data providers at any given moment — see the Methodology note below for why.)
The short version: an active US-Iran conflict has pushed oil up roughly 30% since early July, and that’s driving safe-haven demand into both metals. What’s less widely reported: Treasury yields and Fed rate-hike odds have actually been rising, not falling, at the same time — so this rally is being driven more by geopolitical fear than by easier monetary policy.
Three Things Actually Driving the Move
1. Oil, not the dollar, is the dominant force. Brent crude traded near $91 a barrel on July 21, up about 2% on the day and nearly 17% over the past month, according to Trading Economics, as the US carried out a tenth consecutive day of strikes on Iran following the collapse of an earlier ceasefire. Brent has climbed roughly 30% from its early-July lows, per Investing.com. A separate strike on a Caspian Pipeline Consortium export terminal in Russia has added a second, unrelated hit to supply from Kazakhstan.
2. Rate expectations are firming, not easing. The 10-year Treasury yield climbed to about 4.63% on July 21 as inflation concerns resurfaced, and markets were pricing in roughly a 55% chance of a Fed rate hike in September, up from about 51% the day before (Trading Economics). The Dollar Index, meanwhile, has stayed roughly flat — around 100.9, down just 0.1% over the past month (Trading Economics) — so this isn’t a weak-dollar rally.
3. The US economy looks solid, which argues against a near-term Fed cut. Jobless claims fell to 208,000 for the week ending July 11, a five-week low, and the Philadelphia Fed’s manufacturing index jumped to 41.4 in July, its best reading since 2021. June retail sales rose 0.2%, with the narrower core measure that feeds GDP calculations up a firmer 0.4% (source).
Put together: gold and silver look like they’re getting an independent safe-haven bid from the Middle East conflict — not the usual “Fed pause lifts gold” story. That’s worth knowing, because it means the rally may be more exposed to a quick reversal if the conflict de-escalates than a typical rate-driven move would be.
What’s Really Happening at the Strait of Hormuz
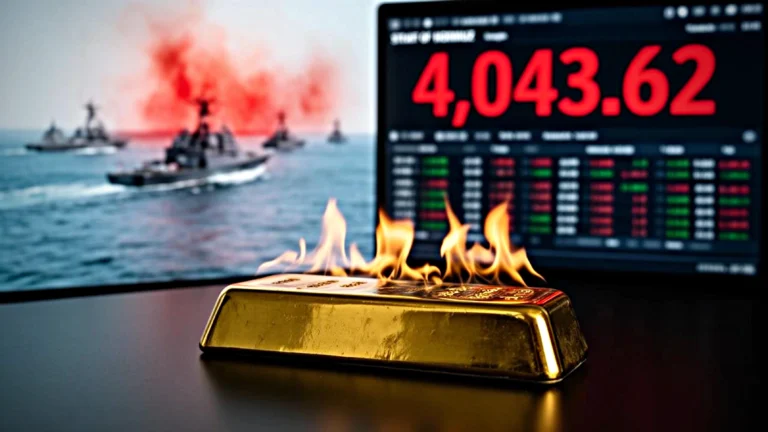
Some coverage this week undersells this as a minor tanker-rerouting story near the Red Sea. The fuller picture: the Strait of Hormuz has been in an active crisis since a US-Israeli military campaign against Iran began on February 28, 2026, and shipping through it has been disrupted, on and off, ever since.
Weekly vessel transits fell to just 53 in the week through July 20 — down 66% from 157 the week before — with tanker and gas-carrier crossings dropping to 30 from 90, according to Lloyd’s List Intelligence data reported by CNBC. That followed a US tanker interdiction days after Washington reinstated a blockade of Iranian ports, per USNI News. Separately, Yemen’s Houthi movement has threatened Saudi-bound shipping through the Bab el-Mandeb Strait in the Red Sea, prompting some tanker owners to reroute.
The accurate framing: this is a real, ongoing disruption to a route that normally carries a large share of the world’s seaborne oil — not a full closure, but not a minor headline either. Traffic continues at sharply reduced, higher-risk levels. A further escalation, or a credible ceasefire, could each move oil sharply from here.
Fed and ECB: What’s Actually on the Table This Week
Federal Reserve — July 28–29. The Fed’s next meeting runs July 28–29, 2026, with the rate decision due at 2:00 PM ET on July 29 (Federal Reserve calendar). No updated economic projections will accompany this meeting, so Chair Kevin Warsh’s press conference will carry extra weight for shaping September expectations. A hold at 3.50%–3.75% is the consensus call.
ECB — July 23, a second look, not a first reaction. This is where a lot of recent coverage misses context: the ECB already raised its three key rates by 25 basis points on June 11, 2026, explicitly citing inflation pressure from the Middle East conflict, lifting the deposit rate to 2.25% (ECB press release). Thursday’s meeting is expected to hold at that level — around 88% of market pricing favors a pause — while the Governing Council assesses June’s move. The door to a further hike isn’t closed, though: several banks expect the real decision point to land at the September meeting, depending on how energy prices behave between now and then.
What to actually watch: not “hike or hold” — that’s mostly priced in both cases. Watch the tone. If either central bank leaves the door open to more tightening, that argues against gold’s rally; if either sounds ready to look past the oil shock, that supports it.
Gold Technical Levels
Quotes below reflect spot XAU/USD; a CFD or futures quote from your broker may sit a few dollars off these levels. One thing worth flagging: different chart timeframes are currently showing different pictures, so it matters which one you’re looking at.
| Timeframe | Support | Resistance | Momentum |
|---|---|---|---|
| Daily | ~$4,090–$4,095 (20-day EMA) | $4,203 (July 6 high) | RSI ~50 — neutral |
| 4-hour | $4,050–$4,080 | $4,140 → $4,200 → $4,278 | RSI >70 — overbought |
| 2-hour | $3,964 | $4,056 → $4,093 → $4,138 | RSI >60 — improving |
The consistent read across all three: gold has cleared its immediate breakout zone and is now testing the $4,140–$4,203 band. A confirmed daily close above $4,203 opens the door toward $4,278–$4,300. A slip back under the daily 20-EMA near $4,090–$4,095 would be the first sign of trouble, with deeper support at $3,942–$3,965.
Short-timeframe RSI is overbought even though the daily RSI is neutral — a sign that a fast short-term move is riding on top of a calmer underlying trend, not necessarily a signal the whole rally is overextended.
Silver Technical Levels
Silver opened this week near $56.80 after falling more than 6% the prior week, bouncing from an intraday low near $55.40 (FX Leaders). Key daily levels: support at $56.59 and $55.41, resistance at $59.00 and $60.23. A close above $59 opens the low-$60s; a break of $55.41 puts a deeper pullback back in play.
Silver’s supply backdrop remains tight: the Silver Institute expects 2026 to be the market’s sixth straight annual deficit year, since most silver is mined as a byproduct of copper, zinc and gold operations and can’t ramp up quickly even as prices rise. Solar, electronics and AI-hardware demand continue to add to the industrial side of that equation.
The Longer-Term Backdrop, Briefly
Two structural forces are pulling in different directions underneath the daily price action.
Central banks keep buying. Official reserves rose a net 41 tonnes in May 2026, led by Poland (18t) and China (10t, its 20th straight month of buying, taking reserves to about 2,331 tonnes), according to the World Gold Council. Poland has bought 64 tonnes in 2026 so far. Nearly 9 in 10 central banks surveyed by the WGC expect global reserves to keep rising over the next year.
ETF investors have been more cautious. Global gold ETFs saw $8.9 billion in outflows in June, though holdings are still up 18 tonnes for the first half of 2026 (World Gold Council). Standard Chartered estimated in late June that roughly 298 tonnes of ETF gold was sitting at a loss near $4,000. In plain terms: investors who bought at higher prices may sell as gold approaches their break-even level, which could cap how far a rally runs before hitting fresh supply.
Gold & Silver: Fed, ECB and Hormuz — Quick Answers
Tap any question. Updated July 22, 2026.
Not entirely, but traffic has fallen sharply — weekly transits dropped by about two-thirds in the week through July 20 versus the week before. It’s a serious, ongoing disruption, not a full closure or a minor scare.
Because this looks like a standalone safe-haven bid tied to the Iran conflict, not a typical rate- or currency-driven rally. That makes it more sensitive to a reversal if the conflict eases.
Yes — a 25 basis point hike on June 11, 2026, citing Middle East-driven inflation. Thursday’s meeting is expected to hold at that new 2.25% level, not react for the first time.
July 28–29, 2026, with the decision at 2:00 PM ET on July 29. No new economic projections accompany this meeting.
Yes. Nearly 9 in 10 central banks surveyed by the World Gold Council expect their reserves to keep growing over the next year.
June’s outflows reflected profit-taking and shifting rate expectations built up over prior weeks, not this week’s move. A meaningful chunk of ETF gold is also sitting at a loss from earlier in the year, which can add selling pressure as prices recover.
Sources
Trading Economics (gold, silver, Brent crude, US Dollar Index, 10-year Treasury yield) · Federal Reserve (FOMC calendar) · European Central Bank (June 2026 rate decision) · CNBC and USNI News (Strait of Hormuz shipping data) · World Gold Council (central bank gold buying and ETF flows) · FX Leaders and the Silver Institute (silver market and supply data) · The Edge for Economic Consultancy / Babypips (US retail sales, jobless claims, Philly Fed data).
Methodology & Disclaimer
Prices reflect a range of quotes across data providers as of the morning of July 22, 2026 (New York time). Gold and silver trade continuously across global sessions, and spot, futures and CFD quotes can differ by several dollars between platforms at any given moment — always check your own broker’s live feed before trading. Technical levels above are based on daily-chart closing data unless a shorter timeframe is specified; EMA and RSI settings follow standard 20-period and 14-period defaults. This article is not financial or investment advice.
Gold and Silver Price Today: The Takeaway on Fed, ECB and Hormuz Risk
Gold and silver’s move higher this week isn’t the usual “Fed pause lifts gold” story. Treasury yields and September rate-hike odds are both rising, and the dollar has barely moved — yet both metals are climbing anyway. That points to an independent, geopolitically driven safe-haven bid tied to the escalating US-Iran conflict and the resulting disruption at the Strait of Hormuz, rather than a shift in monetary policy expectations.
That distinction matters for anyone tracking gold price today or silver price today: a rally built on conflict risk can unwind faster than one built on rate cuts. The Fed’s July 28–29 meeting and the ECB’s July 23 decision are both expected to hold steady, so the real signal to watch is tone, not outcome — any hint that either central bank sees the oil shock as a reason for further tightening would work against gold, while a more relaxed read would support it.
Underneath the daily swings, the longer-term structure remains intact: central banks keep adding to reserves even as ETF investors stay cautious, and technically, gold’s push toward $4,203 and silver’s test of $59 are the levels that will decide whether this recovery extends or stalls.