Gold Forecast This Week: $3,942 Support & Middle East Crisis
Quick Answer: Where Is Gold Headed This Week?
Gold (XAU/USD) is trading near $4,017 an ounce as of July 18, 2026, holding just above a critical trend-line support of $3,942. The metal has posted back-to-back weekly losses despite a softer U.S. inflation print, as escalating military strikes between the United States and Iran keep energy prices — and inflation risk — elevated. Unless gold reclaims the $4,070–$4,100 resistance band, the near-term bias stays tilted to the downside, with $3,886 and the $3,702–$3,650 zone as the next levels traders are watching if selling resumes.
A Second Straight Weekly Loss, Despite a Softer Dollar
Gold has been caught between two forces this week: a broadly weaker Dollar, which should support prices, and an intensifying Middle East conflict keeping oil — and inflation risk — elevated. That second factor has repeatedly won out.
The week opened with a gap lower and a near-3% drop Monday after U.S. Central Command confirmed a second straight day of strikes on Iranian military sites; Tehran retaliated against U.S.-linked positions in Bahrain, Kuwait, Oman, and Jordan. By Friday, the exchange had reached a sixth consecutive night, with strikes extending to Iranian civilian infrastructure, including power stations and a rail terminal.
That escalation matters for gold because of the energy angle: Reuters reported Iran has asked Yemen’s Houthi movement to be ready to shut down Red Sea shipping lanes if U.S. strikes continue hitting Iranian power infrastructure — a risk that would add fresh volatility to global energy supply and inflation.
Fed Policy Backdrop: Rate-Hike Odds Collapse, Gold Still Can’t Rally
What happened:
June CPI cooled to 3.5% from May’s 4.2%, beating the 3.8% forecast, and PPI came in soft as well — sparking a sharp Dollar sell-off and pushing gold up more than 1% on Tuesday. Fed Chair Kevin Warsh’s two-day House testimony then reinforced a steady, anti-inflation stance, calling the CPI print an “imperfect gauge” of underlying price pressure. CME FedWatch now prices roughly a 10% chance of a July hike, down from about 35% before the data (ING pegs it closer to 12%, down from 31%); September hike odds still sit near 50%.
Why it matters for gold:
Falling hike odds and a weaker Dollar should be a clear tailwind for gold, but Warsh’s composed tone helped stabilize the Dollar, and the Middle East conflict kept oil-driven inflation risk elevated. That combination overrode the usual inverse Dollar/gold relationship — by Thursday, gold had reversed nearly 2% to slip back under the psychologically important $4,000 level.
Trading implication:
Fed policy is currently a secondary driver. Unless a hawkish surprise emerges, Middle East headlines are likely to keep dictating direction more than rate expectations — treat soft CPI/PPI prints as short-lived catalysts rather than trend-changers until oil prices stabilize.
Technical Picture: Bears Still in Control Below $4,070
Gold remains below its descending trendline and the 20-day Simple Moving Average (~$4,071), which has capped rallies all week — Wednesday’s $4,081 high confirms that zone as resistance. The daily RSI reads around 40, consistent with an intact bearish bias rather than an oversold extreme.
The weekly chart shows deeper structural damage: gold broke its long-term uptrend line (measured from the February 2024 low) three weeks ago, and the 200-day moving average was lost in early June. Both timeframes now align bearish — though selling hasn’t accelerated since last week’s lower swing high, leaving room for a quicker-than-expected recovery if sentiment shifts.

Key Support and Resistance Levels to Watch
| Level Type | Price Zone | Significance |
|---|---|---|
| Immediate support | $3,950 – $3,920 | Lower boundary of the descending triangle; start of the Nov–Feb trend |
| Trend-low support | $3,942 | Current swing low; a break exposes $3,886 next |
| Secondary support | $3,886 | Prior swing low; at risk if $3,942 fails |
| Deep support zone | $3,702 – $3,650 | 50% retracement and 78.6% Fibonacci retracement of the prior larger upswing |
| Round-number support | $3,800 / $3,720 | Static psychological levels below the triangle base |
| Immediate resistance | $4,070 – $4,100 | 20-day SMA, descending trendline, round-number confluence |
| Secondary resistance | $4,240 | 78.6% Fibonacci retracement of the Nov–Feb uptrend |
| Major resistance | $4,290 / $4,291 | Falling 50-day moving average |
A close back above last week’s swing high would be the clearer signal bulls need before the $4,290 target comes into serious play. Until that happens, rallies into the $4,070–$4,100 band remain more likely to attract sellers than to break out.
Momentum and Moving-Average Snapshot
Short-term momentum readings tell a more balanced story than the weekly trend suggests. On an intraday basis, the 14-day RSI sits in the high 50s and the MACD reading is modestly positive — both consistent with a near-term bounce rather than a full-blown breakdown. Shorter moving averages (5-, 10-, and 20-day) currently sit below spot price and are trending as buy signals, while the 100-day and 200-day averages remain firmly bearish, illustrating the split between short-term stabilization and the longer bearish structure.
| Moving Average | Simple (SMA) | Exponential (EMA) | Signal |
|---|---|---|---|
| MA5 | ~$4,014 | ~$4,012 | Buy |
| MA10 | ~$4,005 | ~$4,008 | Buy |
| MA20 | ~$3,997 | ~$4,004 | Buy |
| MA50 | ~$4,011 | ~$4,008 | Buy |
| MA100 | ~$4,022 | ~$4,027 | Sell |
| MA200 | ~$4,061 | ~$4,043 | Sell |
Broader oscillator readings back up the near-term “buy” lean even as the longer moving averages stay bearish. Stochastic and Stochastic RSI both sit deep in overbought territory, the Commodity Channel Index and Ultimate Oscillator are reading as buy signals, and the Average True Range points to relatively contained volatility for now. Directional strength, measured by the ADX, is neutral — a reminder that this bounce hasn’t yet built the kind of trending conviction that would confirm a genuine reversal.
| Oscillator | Reading | Signal |
|---|---|---|
| RSI (14) | ~57 | Buy |
| Stochastic (9,6) | ~86 | Overbought |
| Stochastic RSI (14) | ~95 | Overbought |
| MACD (12,26) | ~1.09 | Buy |
| ADX (14) | ~15 | Neutral |
| Williams %R | ~-10 | Overbought |
| CCI (14) | ~98 | Buy |
| ATR (14) | ~15.5 | Low volatility |
| Ultimate Oscillator | ~62 | Buy |
| Rate of Change | ~0.45 | Buy |
| Bull/Bear Power (13) | ~18 | Buy |
This split is a familiar pattern after a sharp multi-week decline: fast-moving averages and momentum oscillators catch up to a stabilizing price first, while slower trend measures need more time — and sustained buying — before they turn. It’s also worth noting that this near-term “buy” tilt applies mainly to the shorter intraday and hourly windows; once the lens widens to the daily and weekly close, the broader technical read still skews toward sell, which lines up with the descending-trendline and moving-average resistance discussed above.
Where Gold Sits Across Different Timeframes
Technical signals can look very different depending on which window you’re trading. Zooming across timeframes shows a market that’s short-term overbought but still structurally weak on a daily and weekly basis:
| Timeframe | Signal |
|---|---|
| 30-Minute | Strong Buy |
| Hourly | Strong Buy |
| 5-Hour | Sell |
| Daily | Strong Sell |
| Weekly | Strong Sell |
| Monthly | Buy |
The takeaway: intraday traders are currently seeing strong buy signals off the recent bounce, but anyone holding a daily or weekly view is still looking at a chart dominated by sell signals — a gap that typically closes once one timeframe “wins,” either through a deeper pullback or a sustained multi-day rally.
Pivot Point Levels for the Week Ahead
Pivot points offer another lens on where intraday buying and selling pressure could emerge. Across the major calculation methods, the central pivot clusters tightly around $4,011–$4,013, giving traders a consistent reference point for the session.
| Method | S3 | S2 | S1 | Pivot | R1 | R2 | R3 |
|---|---|---|---|---|---|---|---|
| Classic | 3,992.6 | 3,997.6 | 4,006.5 | 4,011.5 | 4,020.5 | 4,025.5 | 4,034.4 |
| Fibonacci | 3,997.6 | 4,002.9 | 4,006.2 | 4,011.5 | 4,016.9 | 4,020.2 | 4,025.5 |
| Camarilla | 4,011.6 | 4,012.9 | 4,014.2 | 4,011.5 | 4,016.7 | 4,018.0 | 4,019.3 |
| Woodie’s | 3,994.6 | 3,998.6 | 4,008.5 | 4,012.5 | 4,022.4 | 4,026.5 | 4,036.4 |
| DeMark’s | — | — | 4,009.0 | 4,012.8 | 4,023.0 | — | — |
The tight clustering of R1 levels between roughly $4,017 and $4,023 across methods reinforces the same resistance zone flagged in the trend analysis above, while S1 support near $4,006–$4,009 sits just under current spot price as the first line of intraday defense.
What Could Move Gold Next Week
The U.S. economic calendar is thin heading into the week of July 20, which means geopolitical headlines are likely to remain the dominant driver. The main scheduled release is the preliminary S&P Global Purchasing Managers’ Index for July, due Friday. A reading below 50 on either the manufacturing or services component — signaling contraction — would likely weigh on the Dollar and could give gold room to recover toward resistance. A stronger-than-expected print, particularly one showing input costs still rising, would likely reinforce Dollar strength and keep gold capped.
Beyond the PMI data, several other release dates are worth flagging: University of Michigan inflation expectations, weekly ADP employment change data, initial jobless claims, and month-end positioning ahead of the next Fed meeting. None carry the same market-moving weight as this week’s CPI surprise, so Middle East developments are likely to stay in the driver’s seat.
Two Scenarios for XAU/USD Heading Into Next Week
Bearish case: If strikes between the U.S. and Iran continue to escalate and oil prices push higher, the inflation-hedge narrative could get overshadowed by broader risk-off Dollar demand, similar to the pattern seen for most of this month. In that scenario, a decisive break of $3,942 opens the path toward $3,886 and eventually the $3,702–$3,650 zone.
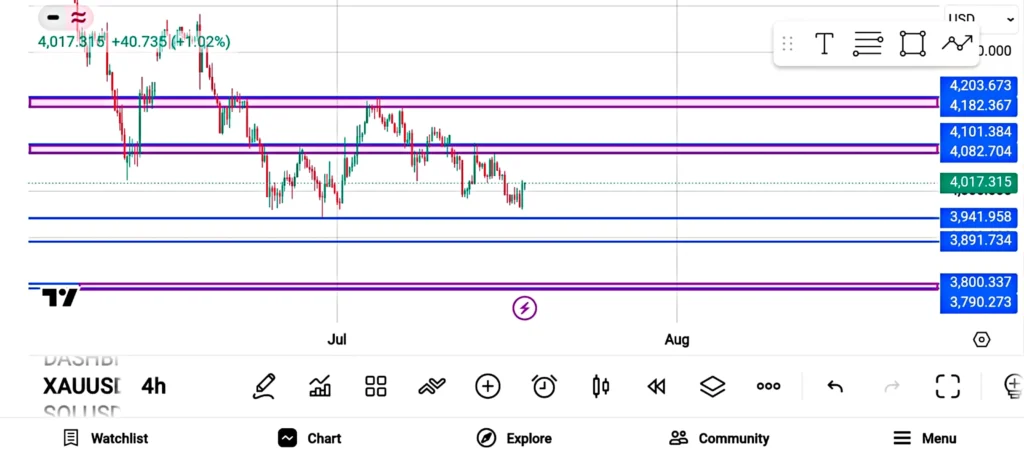
Bullish case: Any sign that Washington and Tehran are willing to step back from military escalation — combined with a soft PMI print — could trigger a relief rally back toward the $4,070–$4,100 resistance cluster. A confirmed close above that zone, followed by a break of last week’s high, would shift the near-term bias back toward $4,240 and the falling 50-day moving average near $4,290.
Frequently Asked Questions About Gold Prices This Week
Hover over any question to reveal the answer.
1Will gold prices go higher or lower next week?
2Why is gold falling even though the U.S. Dollar is weak?
3What is the most important support level for gold right now?
4What resistance level would confirm a gold price recovery?
5Is XAU/USD bullish or bearish right now?
6How are central bank interest rate expectations affecting gold?
7What is gold’s pivot point level today?
8Are gold’s momentum indicators overbought?
Gold price data referenced above reflects spot XAU/USD levels as of July 18, 2026, and is intended for informational purposes only. Gold prices are volatile and can change significantly within minutes; always verify current rates before making investment decisions. This article does not constitute financial advice.
Gold Stays Capped Below Resistance — Geopolitics, Not the Fed, Calls the Shots
Gold (XAU/USD) is holding near $4,017, squeezed between a weakening Dollar and escalating Middle East tensions that keep inflation risk elevated. The bias stays bearish-to-neutral unless price reclaims resistance, with $3,942 the level that decides the next leg. Until the conflict cools or a soft PMI print lands, headlines — not the Fed — will keep driving gold’s next move.