Gold Price Forecast: XAU/USD Remains Weak Near $4,050 as Fed Rate Bets and U.S. Jobs Data Drive the Market

The metal is still struggling below major moving averages, and the short-term trend remains bearish.
At first, this may seem surprising. Gold usually performs well when global tensions rise. It is known as a safe-haven asset, which means investors often buy it during:
- War fears
- Inflation concerns
- Financial stress
- Political uncertainty
- Weakness in paper currencies
But this time, the situation is not that simple.
Gold is facing pressure from several important factors at the same time. These include higher Federal Reserve rate hike expectations, U.S. labor market data, and renewed geopolitical risks linked to the United States and Iran near the Strait of Hormuz.
These issues are connected. Trouble in the Middle East can raise energy prices. Higher energy prices can push inflation higher. If inflation stays high, the Federal Reserve may keep interest rates higher for longer or even raise them again.
That is why gold is not getting a clean safe-haven rally right now. The market is worried that geopolitical stress could create more inflation, and more inflation could keep the Fed hawkish.
Higher interest rates are usually bad for gold because gold does not pay interest.
This article explains the latest gold price forecast, key technical levels, support and resistance zones, short-term outlook, monthly outlook, and the main market events that traders should watch this week.
Quick Summary
Gold remains weak near the $4,050 level.
The market is still bearish while XAU/USD trades below $4,240.
The $4,000 level is the most important short-term support.
A break below $4,000 could open the door toward $3,959 and $3,886.
A move above $4,240 could give buyers some short-term hope.
The U.S. jobs report may decide the next big move.
Fed rate expectations, the U.S. dollar, Treasury yields, and Middle East headlines remain the main drivers.
Gold Price Today: What Is Happening?

Gold price remains in negative territory around the $4,050 level. The metal has failed to build strong upside momentum and continues to trade below important moving averages.
This shows that sellers are still controlling the market in the near term.
The current weakness is mainly linked to rate hike expectations. Traders are watching the Federal Reserve closely because interest rates play a major role in gold price movement.
When rates are expected to rise, gold often becomes less attractive. This is because investors can earn income from:
- Bonds
- Cash
- Treasury yields
- Other interest-paying assets
Gold, on the other hand, does not pay yield.
Why the U.S. Dollar Matters for Gold
The U.S. dollar is also very important for gold.
Gold is priced in dollars. So when the dollar rises, gold becomes more expensive for buyers using other currencies. This can reduce demand and push prices lower.
In recent sessions, gold has received some support from a softer dollar. However, that support has not been strong enough to fully reverse the bearish pressure.
At the same time, geopolitical headlines are creating uncertainty. Military clashes and tensions around the Strait of Hormuz have revived fears of higher oil prices and stronger inflation.
Normally, this type of risk can support gold. But right now, traders are more focused on what rising inflation could mean for Federal Reserve policy.
So the market is caught between two forces:
- Safe-haven demand is helping gold avoid a deeper fall.
- Fed rate hike expectations are keeping sellers active.
Why Gold Is Falling Despite Middle East Tensions
It is not tied to one company, one government, or one currency in the same way stocks or paper money are. That is why gold is often called a defensive asset.
However, not every geopolitical crisis leads to a strong gold rally.
The Main Reason
Traders do not look at only one factor. They also look at:
In the current situation, tensions between the United States and Iran have increased concern about the Strait of Hormuz. This area is very important for global oil shipments.
If there is serious disruption there, oil prices can rise sharply.
Higher oil prices can feed into inflation because:
When inflation becomes a bigger concern, the Federal Reserve may need to take a tougher policy stance. That means higher interest rates or delayed rate cuts.
Higher rates increase the opportunity cost of holding gold.
In simple words:
War risk may support gold, but rate hike risk is hurting gold more right now.
The Federal Reserve Is the Main Driver
The Federal Reserve remains the biggest short-term driver for gold.
Gold traders are watching every piece of U.S. economic data because it can change expectations for interest rates.
If inflation stays high and the labor market remains strong, the Fed may have more reason to keep policy tight. That would likely pressure gold.
If the economy starts to weaken, the Fed may become less aggressive. That could help gold recover.
Why Higher Rates Hurt Gold
Higher interest rates are usually negative for gold for two main reasons.
1. Gold Does Not Pay Interest
Gold does not offer income. Bonds and cash can pay interest. So when rates rise, many investors prefer assets that offer returns.
2. Higher Rates Can Support the Dollar
Higher rates often make the U.S. dollar stronger. A stronger dollar can make gold more expensive for international buyers.
This relationship is one of the most important things for gold traders to understand.
Gold does not move only because of fear. It also moves because of:
U.S. Jobs Data Could Decide the Next Big Move
This week, the market is focused on U.S. labor market reports, especially the Nonfarm Payrolls data.
Jobs data is important because it gives clues about the strength of the U.S. economy.
A strong labor market can support higher interest rates. If companies are still hiring and wages remain firm, inflation pressure may stay alive. That could make the Fed more comfortable with a hawkish stance.
A weak labor market can do the opposite. If job growth slows sharply or unemployment rises, traders may expect the Fed to become less aggressive. That could weaken the dollar and support gold.
Possible Market Reaction to Jobs Data
If the Jobs Report Is Strong
Gold may face more selling pressure.
A strong report could:
If the Jobs Report Is Weak
Gold may get a short-term recovery.
A weak report could:
For gold, the jobs report is not just another data release. It can change the short-term direction of the market.
This is why traders should be careful before entering large positions before the data. The market can move quickly after major U.S. economic reports.
Gold Technical Analysis: Bears Still Control the Chart
The technical picture for gold remains weak.
XAU/USD is trading below the 21-day, 50-day, 100-day, and 200-day simple moving averages. This is a bearish signal because it shows that price is below key trend levels.
When gold trades below these averages, sellers usually have more confidence.
Key Moving Averages to Watch
21-Day Simple Moving Average
The 21-day simple moving average is near $4,240.
This is the first important resistance level. As long as gold remains below this area, the short-term trend stays negative.
50-Day Simple Moving Average
The 50-day simple moving average is near $4,453.
This is a major resistance area. If gold reaches this level, traders may watch for selling pressure.
200-Day Simple Moving Average
The 200-day simple moving average is near $4,479.
This level is also important because many traders use it to judge the long-term trend.
100-Day Simple Moving Average
The 100-day simple moving average is higher, near $4,674.
This level is far above the current price, which shows how much pressure gold is facing.
RSI Shows Weak Momentum
The Relative Strength Index, or RSI, is near 36.
This means the market is weak, but it is not deeply oversold yet.
When RSI falls below 30, traders often start watching for a possible bounce. Since gold is not yet oversold, there may still be room for further weakness.
Overall, the chart favors sellers. Gold needs to recover above $4,240 to improve the short-term outlook.
Until that happens, rallies may continue to face selling pressure.
Death Cross Adds to Bearish Sentiment
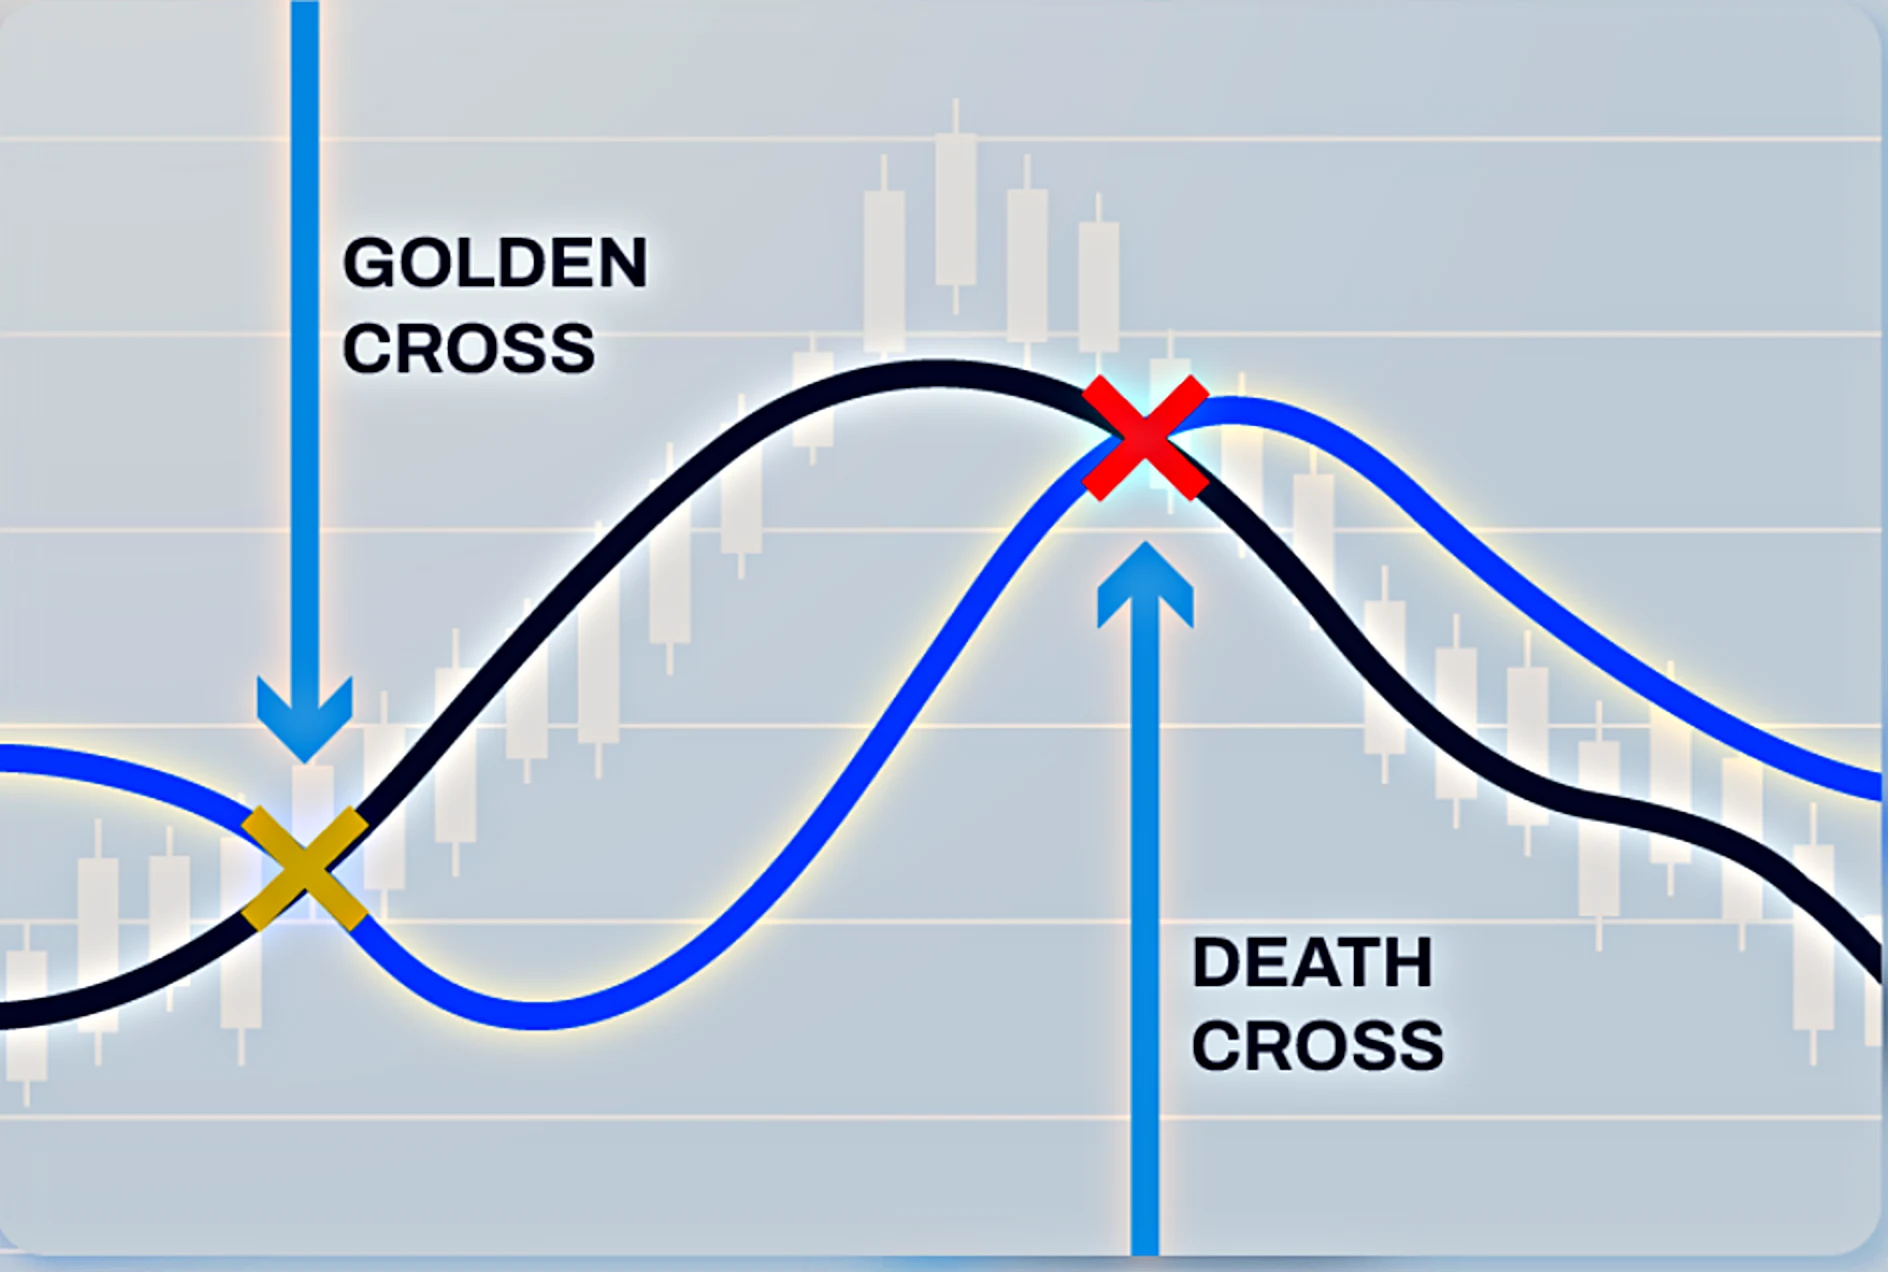
Gold has also confirmed a Death Cross after the 50-day moving average closed below the 200-day moving average on a weekly basis.
A Death Cross is a bearish technical signal. It happens when a shorter-term moving average falls below a longer-term moving average.
Many traders see it as a sign that momentum has shifted lower.
What the Death Cross Means for Gold
A Death Cross does not always mean that gold will continue falling in a straight line. Markets can bounce even during bearish trends.
But the Death Cross does show that the medium-term trend has weakened.
It can also affect trader psychology. When a Death Cross appears:
That is why gold may struggle to recover unless it can move back above key moving averages.
A simple bounce is not enough. Bulls need a strong daily or weekly close above resistance to show that the trend is changing.
For now, the Death Cross supports the idea that gold remains in a sell-the-rally phase.
Key Gold Support Levels to Watch
The most important short-term support level is $4,000.
This level matters because it is both psychological and technical. Round numbers often attract attention in financial markets.
Traders place orders around these areas, and price reactions can be strong.
Main Support Zones
$4,000 Support
This is the key short-term support level.
If gold holds above $4,000, buyers may try to create a short-term bounce.
A move from this area could send gold toward:
- $4,150
- $4,200
- $4,240
But that would still be only a recovery inside a bearish structure unless gold breaks above $4,240.
$3,959 Support
If gold breaks below $4,000, the next support level to watch is around $3,959.
This level may attract short-term buyers, but traders should wait for confirmation.
$3,886 Support
Below $3,959, the next important support is around $3,886.
If price reaches this area, the market may become more volatile.
$4,069 to $3,707 Value Zone
The wider long-term value zone sits between $4,069 and $3,707.
Gold has already started testing this zone. Long-term investors may see this area as attractive, especially if they believe gold’s broader uptrend is still alive.
However, active traders should be more careful.
A support zone is not the same as a buy signal. The market needs to show signs of strength before a counter-trend trade becomes safer.
Key Gold Resistance Levels to Watch
The first major resistance level is near $4,240.
This level is important because it lines up with the 21-day simple moving average.
If gold cannot break above this area, sellers may continue to control the short-term trend.
Main Resistance Zones
$4,240 Resistance
A move above $4,240 would be the first sign that bearish pressure is slowing.
It may also encourage short-term buyers to target the next resistance zone.
$4,453 to $4,479 Resistance Zone
The next major resistance area is between $4,453 and $4,479.
This zone is very important because it includes the 50-day and 200-day moving averages.
If gold reaches this area, traders should watch closely for rejection or breakout.
$4,674 Resistance
Above that, the next upside target is near $4,674, where the 100-day moving average is located.
But for now, that level looks far away. Gold needs to clear several resistance barriers before traders can seriously talk about a move toward that area.
In simple terms:
Gold must first reclaim $4,240 before the bullish case improves.
Gold Price Forecast for Today
For today, the gold price forecast remains bearish while XAU/USD trades below $4,240.
If sellers stay active, gold may move back toward the $4,000 support level. A clean break below $4,000 could open the door toward $3,959 and $3,886.
If gold holds above $4,000, a short-term bounce is possible.
The first upside target would be around $4,150. After that, traders may watch $4,200 and then $4,240.
However, a bounce should not be confused with a full reversal. The short-term structure remains weak while price is below the 21-day moving average.
Today’s Simple Trading View
For intraday traders, the best approach is to watch how gold behaves near $4,000.
The simple daily view is this:
Gold remains under pressure below $4,240, and $4,000 is the key support level to watch.
Gold Price Forecast for This Week
This week could be very volatile for gold because of U.S. economic data.
The most important event is the U.S. jobs report. Traders will use this data to judge whether the Fed may stay hawkish.
Strong job growth may increase rate hike expectations, while weak job growth may reduce them.
Weekly Bearish Scenario
If the jobs report is strong, gold may face fresh selling pressure.
In that case, a break below $4,000 becomes more likely.
The next downside targets would be:
Weekly Bullish Scenario
If the jobs report is weak, gold may recover.
A weaker labor market could reduce Fed rate hike bets and pressure the dollar. That would give gold a chance to bounce toward $4,240.
But even if gold bounces, traders should not ignore the larger trend.
The market remains below major moving averages. A true bullish shift would require:
For the week ahead, the forecast is cautious. Gold may stay under pressure unless U.S. data gives buyers a reason to return.
Gold Price Forecast for the Next Month
The monthly gold outlook remains bearish to neutral unless price can reclaim key resistance.
If gold continues to trade below $4,240, the risk of further downside remains high.
A move below $4,000 could push the metal deeper into the long-term value zone.
Monthly Downside Targets
The next important downside areas are:
These levels may come into focus if the dollar stays strong and rate hike expectations continue to rise.
Monthly Recovery Scenario
Gold still has long-term support from:
These factors may limit the downside over time.
The monthly outlook depends heavily on the Federal Reserve. If rate hike expectations keep rising, gold may continue to struggle.
If economic data weakens and the dollar falls, gold may stabilize.
A close above $4,240 would be the first positive sign. A close above $4,479 would be a stronger signal that the market is trying to recover.
Until that happens, the monthly bias remains cautious.
Gold may not collapse, but it is also not showing enough strength for a confident bullish forecast.
Long-Term Gold Outlook
The long-term gold outlook is more balanced than the short-term chart.
In the short term, gold is weak because of:
But over the long term, gold still has important support factors.
Why Long-Term Investors Still Watch Gold
Central banks continue to view gold as a reserve asset. Many countries buy gold to diversify away from paper currencies and reduce risk.
This type of demand is steady and does not change because of one weekly jobs report.
Gold is also used as protection against:
This is why long-term investors may not panic during a correction. They may see pullbacks as chances to build positions slowly.
However, timing still matters.
Buying too early during a downtrend can be risky. It is often better to wait for price stability or clear support before adding exposure.
For long-term investors, the $4,069 to $3,707 zone may be important. This area could attract buying interest if gold continues to fall.
But investors should still use patience and avoid putting all capital into the market at once.
What Could Push Gold Lower?
Several factors could push gold lower in the coming days or weeks.
1. Strong U.S. Jobs Data
If the labor market remains strong, traders may expect the Fed to stay hawkish. That would likely pressure gold.
2. Stronger U.S. Dollar
Since gold is priced in dollars, a rising dollar usually makes gold more expensive for global buyers.
3. Higher Treasury Yields
When yields rise, gold becomes less attractive because it does not provide income.
4. Weak Technical Structure
Gold is below major moving averages, and the Death Cross adds to bearish sentiment.
5. Break Below $4,000
If this level fails, technical sellers may become more aggressive.
These factors do not guarantee more downside, but they increase the risk. Traders should watch them closely before making decisions.
What Could Help Gold Recover?
Gold could recover if the market gets a softer economic signal.
A weak jobs report would be the biggest short-term bullish factor. If hiring slows or unemployment rises, traders may reduce Fed rate hike expectations.
That could weaken the dollar and support gold.
Bullish Factors for Gold
Gold could recover if:
From a technical view, gold needs to break above $4,240 to show early recovery.
A move above $4,479 would be much stronger.
Until then, any bounce may remain limited.
Trading Tips for Gold This Week
This is not the best week for emotional trading. Gold may move sharply because of U.S. jobs data and geopolitical headlines.
Traders should stay careful and plan ahead.
Important Tips
Important levels include:
A trader may sell rallies, while a long-term investor may slowly build positions. These are different strategies.
Simple View for Beginners
For beginners, the current gold market can be explained in a simple way.
Gold is weak because traders think interest rates may stay high. Higher interest rates make gold less attractive because gold does not pay interest.
Gold is also below important moving averages. This means the chart is weak.
Beginner-Friendly Summary
So the basic idea is simple:
Gold is bearish for now, but a weak U.S. jobs report could give buyers a chance.
FAQs
Why is gold price falling today?
Gold is falling because traders are focused on Federal Reserve rate hike expectations. Higher interest rates and a stronger U.S. dollar usually make gold less attractive.
Is gold still a safe-haven asset?
Yes, gold is still a safe-haven asset. However, the market is currently more focused on inflation and interest rates than safe-haven demand.
What is the key support level for gold?
The key short-term support level is $4,000. If gold breaks below this level, sellers may target $3,959 and $3,886.
What is the key resistance level for gold?
The first major resistance level is near $4,240. A stronger resistance zone is between $4,453 and $4,479.
Can gold recover this week?
Gold can recover if the U.S. jobs report is weaker than expected, the dollar falls, or Treasury yields move lower. But gold needs to break above $4,240 to show real short-term strength.
Is gold bullish or bearish right now?
Gold is bearish in the short term because it is trading below major moving averages and has confirmed a Death Cross. The outlook would improve if gold moves back above $4,240.
Should long-term investors buy gold now?
Long-term investors may watch the $4,069 to $3,707 zone as a possible value area. However, it is better to build positions slowly and manage risk instead of buying aggressively during a downtrend.
What will decide gold’s next move?
The next big move will likely depend on U.S. jobs data, Fed rate expectations, the U.S. dollar, Treasury yields, and Middle East headlines.
Conclusion
Gold price remains under pressure near the $4,050 area as traders balance geopolitical risk against Federal Reserve rate hike expectations.
While tensions near the Strait of Hormuz can support safe-haven demand, they also raise inflation concerns. This keeps the market focused on the possibility of tighter monetary policy, which is negative for gold.
From a technical point of view, XAU/USD remains weak. Price is trading below the 21-day, 50-day, 100-day, and 200-day moving averages. The Death Cross also adds more bearish pressure.
The RSI shows weak momentum, but gold is not deeply oversold yet. This means sellers may still have room to push prices lower if support breaks.
The most important level to watch is $4,000.
If gold holds above this level, a short-term bounce toward $4,150 or $4,240 is possible. But if gold breaks below $4,000, the next downside targets may be $3,959 and $3,886.
A deeper move could bring the long-term value zone between $4,069 and $3,707 back into focus.
For bulls, the first major task is to reclaim $4,240. A move above this level would show that bearish pressure is easing. A stronger breakout above the $4,453 to $4,479 resistance zone would be needed to change the broader outlook.
This week’s U.S. jobs data may decide the next major direction.
Strong jobs numbers could support the dollar, lift rate hike expectations, and push gold lower. Weak jobs numbers could reduce Fed pressure and give gold room to recover.
For traders, patience is important. This is a news-heavy week, and gold may move sharply. It is better to wait for clear signals instead of chasing price.
For long-term investors, lower levels may offer value, but risk management is still important.
Overall, gold is not out of danger yet. The market remains bearish below $4,240, and the $4,000 support level is the key line to watch. Until gold breaks above major resistance, sellers remain in control.