Gold Weekly Forecast & Analysis: 13–17 July 2026
Quick Answer: Gold (XAU/USD) enters the week of 13–17 July 2026 near $4,100 per ounce after slipping roughly 1.5% last week. The bias is neutral-to-bearish while price trades below both its 50-day and 200-day moving averages and stays capped under the $4,160–$4,190 resistance zone. The dominant catalysts are Tuesday’s US CPI report (14 July) and Fed Chair Kevin Warsh’s two-day congressional testimony. In the bearish scenario, a hot inflation print that reinforces September rate-hike bets could drag gold toward $4,020–$3,940; in the bullish scenario, a cooler reading may spark a relief rally back to $4,190–$4,310. Continued range-bound consolidation near $4,100 remains the base case until one of those triggers fires — no single outcome is assured.
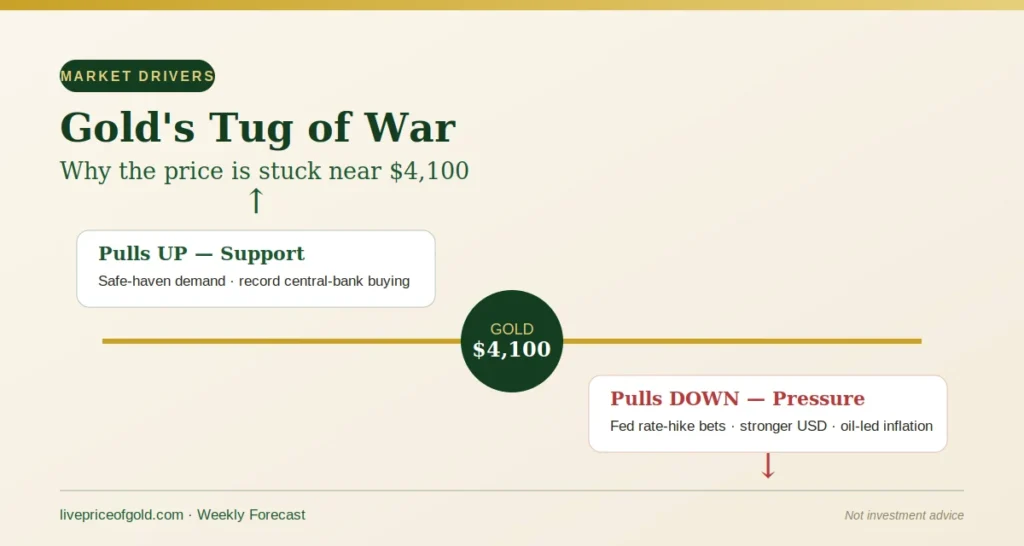
Spot gold closed last week around the $4,100 mark, down about 1.5%, pressured by a 5% surge in crude oil after fresh military exchanges between US and Iranian forces reignited inflation worries (Trading Economics market summary, 10 July 2026). Higher energy costs strengthen the case for the Federal Reserve to keep policy tight — or even tighten further — and that is exactly what has been holding bullion back.
The technical picture reflects that pressure. Gold now trades roughly 26% below its all-time peak of $5,595 set in late January 2026, and sits below both key trend gauges — the 200-day simple moving average near $4,340 and the 50-day near $4,730 (calculated on daily spot closes). Trading under both averages tells us the medium-term structure remains damaged; the multi-year bull market that began in 2024 is not officially broken, but bulls have no technical control until at least the 200-day line is reclaimed. J.P. Morgan’s metals desk has described the current phase as a consolidation within the longer uptrend rather than a structural reversal — a fair characterisation, but one that offers little comfort for the weeks immediately ahead.
Two conflicting forces define the setup. On one side, geopolitical risk in the Middle East and record central-bank accumulation — China posted its biggest monthly reserve addition in over two and a half years, roughly 15 tonnes in June (Reuters, 7 July 2026) — provide a durable floor. On the other, futures-market pricing puts the probability of at least one Fed rate hike before year-end at roughly 60–85%, depending on the horizon measured (Fed funds futures via Trading Economics and FXStreet, 9–10 July 2026) — and a yield-less asset like gold struggles whenever borrowing costs threaten to rise.
Context matters here, because inflation has been accelerating, not cooling. Headline CPI has climbed for three straight readings: 3.3% in March, 3.8% in April, and 4.2% in May — the hottest print since April 2023 (BLS Consumer Price Index report, released 10 June 2026). Energy is doing the damage: the energy index is up 23.5% year-on-year, with gasoline up 40.5%, a direct consequence of the Iran conflict and disruption around the Strait of Hormuz. Core CPI (ex food and energy) sits at 2.9%.
The June report lands Tuesday, 14 July at 8:30 am ET (BLS release schedule). There is a genuine case for moderation — front-month WTI crude fell more than 20% during June before this month’s rebound (Kiplinger economic calendar preview), and several economists, including Oxford Economics’ Nancy Vanden Houten, have argued May likely marked the headline peak. But a fourth consecutive acceleration would be the most bearish plausible outcome for gold, because it would significantly strengthen the case for a rate hike ahead of the Fed’s 28–29 July meeting — though the Fed has signalled it intends to look through supply-driven energy shocks where possible, so even a hot print is not a guaranteed hike trigger.
This is one of the heaviest data weeks of the summer, and volatility should stay elevated from Tuesday onward.
| Date | Event | Why It Matters for Gold |
|---|---|---|
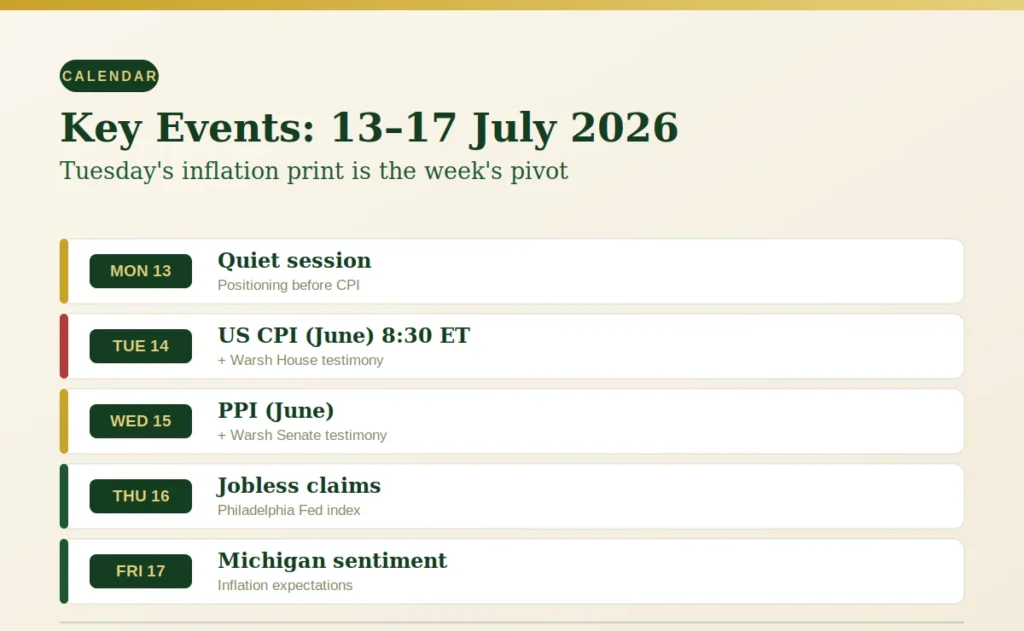
| Tue, 14 July | US CPI & Core CPI (June) – 8:30 am ET | The single most important release of the week. May CPI hit 4.2% YoY (up from 3.8% in April); a fourth straight acceleration would harden rate-hike bets and pressure gold |
| Tue, 14 July | Fed Chair Warsh testifies (House) – 10:00 am ET | Any hawkish lean on energy-driven inflation hits bullion instantly |
| Wed, 15 July | Warsh testifies (Senate Banking) + PPI (June) | Pipeline inflation data plus round two of policy signals |
| Thu, 16 July | Initial Jobless Claims, Philadelphia Fed Index | Strong labor data = higher hike odds = gold headwind |
| Fri, 17 July | University of Michigan Consumer Sentiment & Inflation Expectations | Rising inflation expectations cut both ways: hedge demand vs. Fed hawkishness |
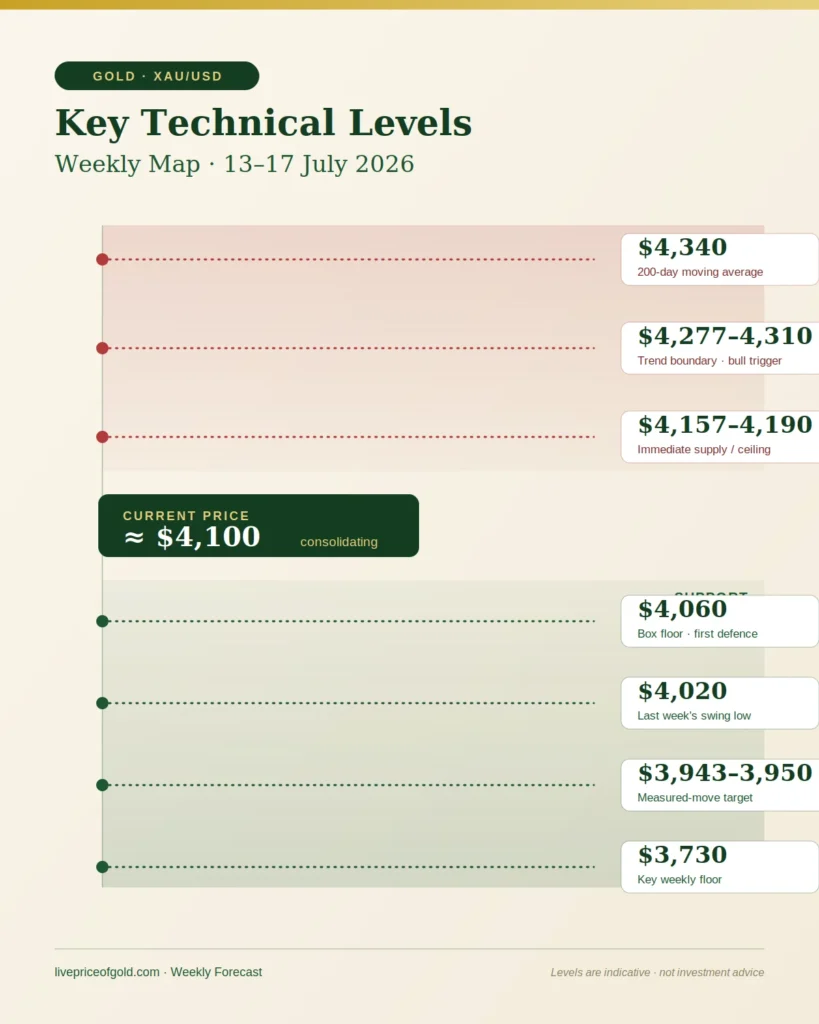
Gold has been consolidating, and the weekly map is well defined. Methodology and attribution: the consolidation boundaries (~$4,060–$4,157) reflect the range published by LiteFinance’s daily XAU/USD analysis as of 10 July 2026; the $4,166–$4,188 and $4,277–$4,310 resistance zones come from independent analyst Alex Rodionov’s margin-zones methodology (via LiteFinance); the moving-average figures were cited by J.P. Morgan’s metals team. Swing-based levels ($4,020, $3,730) correspond to visible daily lows from the past four weeks and can be verified on any XAU/USD daily chart. The $3,943 downside target is a measured move — the ~$100 box height projected below the box floor — and should be treated as an estimate, not a precise level.
Key Levels & Where They Come From
Gold is consolidating in a well-defined range. Every level below is attributed to its source so you can verify it yourself — nothing here is a black box.
| Level / Zone | Type | Source & Methodology |
|---|---|---|
| $4,277–4,310 | Resistance | Margin-zones methodology by independent analyst Alex Rodionov, via LiteFinance. Marks the short-term trend boundary and bull trigger. |
| $4,166–4,188 | Resistance | Alex Rodionov’s margin-zones (via LiteFinance). The immediate supply cap where recovery attempts stalled. |
| ~$4,340 · ~$4,730 | Moving avg | 200-day (~$4,340) and 50-day (~$4,730) simple moving averages, as cited by J.P. Morgan’s metals team. Price sits below both. |
| $4,060–4,157 | Range box | Consolidation boundaries from LiteFinance’s daily XAU/USD analysis (as of 10 July 2026). The operative structure until broken. |
| $4,020 | Support | Swing-based level — a visible daily low from the past four weeks. Verifiable on any XAU/USD daily chart. |
| $3,943 | Estimate | Measured move — the ~$100 box height projected below the floor. Treat as an estimate, not a precise level. |
| $3,730 | Support | Swing-based level — a visible daily low from the past four weeks. The key weekly floor bulls must hold. |
Levels are indicative and for education only — not investment advice.
Resistance levels
Support levels
On momentum, the daily RSI (14) is hovering near the neutral 50 mark and MACD is flat around its signal line — both consistent with a market waiting for a catalyst rather than trending. For volume confirmation on any breakout, watch COMEX gold futures volume and open interest (spot XAU/USD has no centralised volume figure); a range break accompanied by expanding futures volume is far more trustworthy than one on thin summer liquidity.
A soft June CPI reading is the cleanest bullish trigger. If inflation shows the energy shock fading, markets would trim September hike odds, the dollar would likely soften, and gold could squeeze back through $4,157–$4,190 toward the $4,277–$4,310 trend boundary. Beyond the data, any re-escalation in the Strait of Hormuz — attacks on shipping, retaliatory strikes, or a breakdown in the fragile US-Iran talks — would revive safe-haven flows regardless of what the Fed says. Persistent official-sector buying, led by the People's Bank of China, remains the structural tailwind that has cushioned dips throughout this correction.
Bearish Scenario: What Drags Gold Lower?
A hot CPI print combined with hawkish Warsh testimony is the most damaging pairing for bulls. That combination would likely push market-implied hike probabilities sharply higher, tend to lift Treasury yields and the dollar together, and put the $4,060 range floor under serious strain. Below $4,020, the measured-move target at $3,943 comes into play, and in an extended washout the June low near $3,730 is the next reference. Confirmed progress in US-Iran negotiations would compound the pressure by draining the geopolitical premium — Trump's recent comment that Tehran reached out seeking a deal already took some fear out of the market late last week.
Wall Street is genuinely split, and the divide itself is informative:
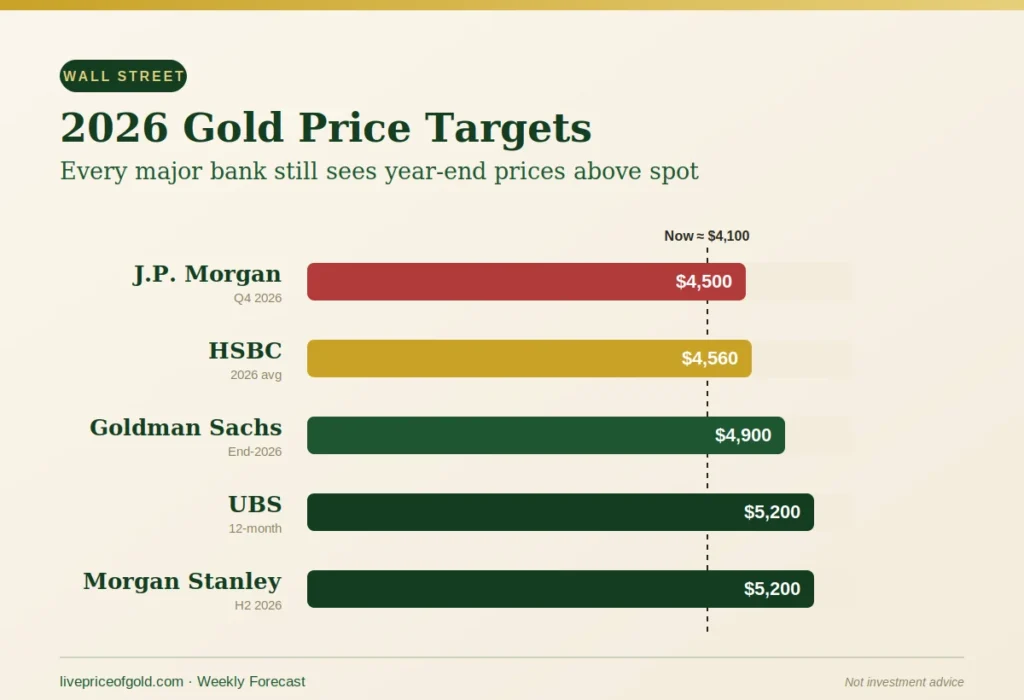
The takeaway: even the most cautious major bank (J.P. Morgan at $4,500 by Q4) sits about 10% above current spot, while the bulls see 20%+ upside — but every one of those targets is hostage to whether the Fed hikes into an energy shock or looks through it.
Monday, 13 July:
Quiet calendar. Expect positioning and range trading inside $4,060–$4,160 as desks square up ahead of CPI. Low-volume drifts in either direction should be treated with caution.
Tuesday, 14 July:
The pivot day. CPI at 8:30 am ET followed by Warsh's House testimony at 10:00 am ET means two volatility windows within ninety minutes. This is likely to produce the widest daily range of the week.
Wednesday, 15 July:
Follow-through day. PPI adds pipeline-inflation colour while Warsh faces the Senate. Initial CPI reactions are frequently retraced once positioning washes out, so Wednesday's close is worth weighting at least as heavily as Tuesday's first move when judging direction.
Thursday, 16 July:
Jobless claims and the Philly Fed index test the "resilient economy" narrative. Weak numbers would help gold by softening the hike case.
Friday, 17 July:
Michigan sentiment and inflation expectations close the week. With Middle East headline risk unresolved, some traders may prefer to reduce short exposure into the weekend, which can produce late-session bounces — a tendency, not a rule.
Disclaimer: This analysis is for informational and educational purposes only and does not constitute investment advice. Gold trading involves substantial risk. Always conduct your own research and consult a licensed financial advisor before making trading decisions.
Trading Strategy Ideas for the Week
Four approaches to the same chart. The common thread is discipline — let the data pick the direction and respect every invalidation level.
Range Traders
The $4,060 support / $4,157 resistance box is the operative structure until broken. Fading the extremes is the textbook consolidation play — but reduce size around Tuesday's data, when intraday ranges routinely widen.
Breakout Traders
Wait for a decisive daily close outside the box, confirmed by expanding COMEX futures volume versus its 20-day average. Don't chase the first spike — let the close do the confirming.
Position Traders
The higher-timeframe structure rewards patience. Staggered bids into the $3,940–$3,730 demand shelf align with institutional year-end targets that still sit above current spot, even after recent downgrades.
Risk Management
CPI, PPI and two testimony sessions land in three days. Liquidity around each release can thin sharply, producing fast two-way spikes that hunt tight stops.
Educational scenarios only — not investment advice.
Frequently Asked Questions
The path depends almost entirely on Tuesday's US CPI. A softer inflation print favors a recovery toward $4,190–$4,310; a hotter one — extending May's 4.2% acceleration — risks a slide to $4,020–$3,940. Until that release, expect choppy consolidation near $4,100.
Algorithmic models cluster around $4,050–$4,160 for Friday's close, with the wider weekly extremes stretching from roughly $3,940 (bearish CPI outcome) to $4,310 (bullish outcome).
Because the conflict is inflationary. Surging oil prices — gasoline is up more than 40% year-on-year — raise the odds that the Federal Reserve hikes rates, and higher rates increase the opportunity cost of holding non-yielding gold. The rate effect is currently outweighing the safe-haven effect.
The long-term uptrend from 2024 has not been invalidated, but the short-to-medium-term picture is corrective: price sits below both the 50-day and 200-day moving averages and roughly 26% under January's record high. Most major banks still forecast year-end prices above current spot, though J.P. Morgan recently trimmed its target to $4,500 and flagged downside risks.
Long-term accumulators may find value on dips toward $4,020–$3,940, given continued central-bank buying and bank targets ranging from $4,500 (J.P. Morgan) to $5,200 (UBS, Morgan Stanley). Short-term traders should wait for the CPI reaction before committing, as the range could break violently in either direction.
8:30 am Eastern Time (5:30 pm Pakistan Standard Time), published by the US Bureau of Labor Statistics, covering June 2026 data.